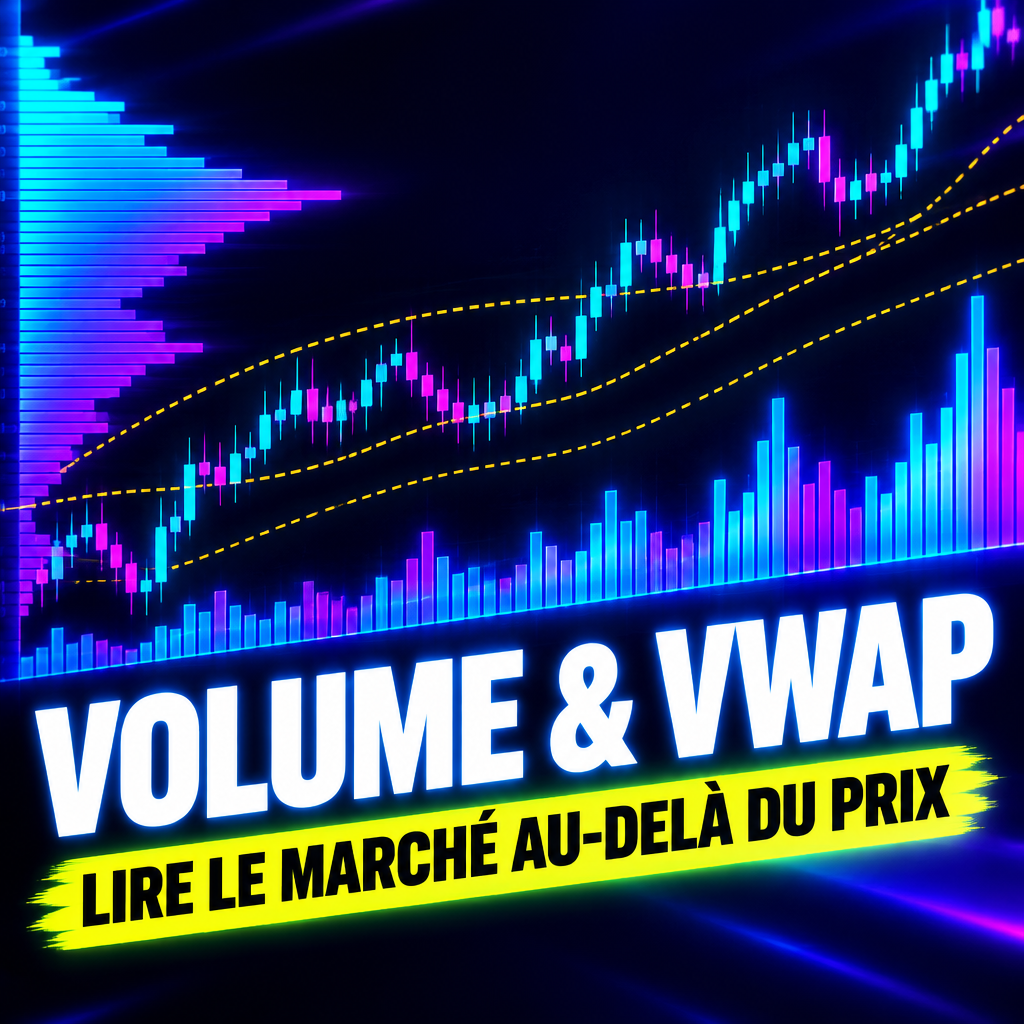
Volume is the most underused data point among prop firm traders. Most candidates spend months on chart patterns and momentum indicators, then wonder why their entries consistently turn against them. The answer often comes down to one line: they trade price without looking at who is behind the move. On indices, that information is nonetheless available for free, continuously, on the underlying futures contracts. This article explains how to read volume with three complementary tools, VWAP, volume profile and order flow delta, and how to integrate them into a trading plan that fits the rules of a prop firm challenge.
Why volume changes the game on indices in prop firm trading
A prop firm challenge imposes two constraints that do not exist on a personal account: a daily loss limit (generally 4 to 5% of the initial capital) and a profit target within a limited time (8 to 10% in phase 1 according to the most widespread rules in 2026, with 30 calendar days in most offers). These two constraints have a direct consequence: you cannot afford to accumulate false starts. Every failed entry consumes not only capital, but also psychological margin.
Yet false starts cluster in areas that are perfectly identifiable in advance: price zones where volume has built up without a clear direction. A NAS100 that has been stalling for three hours around 21,450 with collapsing volume does not mean the same thing as a NAS100 consolidating at the same level with rising volume. In the first case, the market is waiting for a catalyst. In the second, participants are positioning. The displayed price is identical; the probability of a successful breakout is not.
Third, a more structural reason: the most serious prop firms check the consistency of your style. A trader chaining 40 micro-scalps a day on random levels triggers a manual review more often than a trader taking 3 to 5 argued positions. Volume provides precisely the kind of objective justification that makes a trading journal credible in the event of a dispute.
The three ways to read volume, from simplest to most refined
There are three families of tools, ranked here by increasing complexity and learning cost. None replaces the other two: they answer different questions.
1. VWAP: where price sits relative to the volume-weighted average price
The VWAP (Volume Weighted Average Price) is the average of prices weighted by the volumes traded since the session open. It is the benchmark indicator for institutional desks, for a simple reason: it measures the price at which the market actually traded, not the price at which it closed.
On the NAS100, the VWAP recalculates every day at the US session open (3:30 pm Paris time). Two readings are enough in 80% of cases:
- Price above VWAP, VWAP sloping up: buyers control the session. Pullbacks toward VWAP are buying opportunities, not reversals.
- Price below VWAP, VWAP sloping down: the opposite setup. Rallies toward VWAP are sells.
The slope matters as much as the position. A price above a flat VWAP signals a balanced session where breakouts most often fail: this is exactly the context in which a challenge trader loses capital by chaining directional entries.
2. Volume profile: where the market agreed to trade
The volume profile (or VPVR, volume profile visible range) displays the volume traded per price level rather than per unit of time. It reveals three elements:
- The POC (Point of Control): the level with the highest volume over the observed period. It is the market's magnet.
- The value area: the zone containing 70% of total volume. As long as price stays inside it, the market is in balance.
- HVN and LVN: high activity zones (High Volume Nodes), which slow price down, and low activity zones (Low Volume Nodes), which price moves through quickly.
The operational benefit is immediate: a target placed just before an HVN has a much higher chance of being reached than a target placed behind it. Conversely, a stop placed in the middle of an LVN will often be hit by a simple liquidity move, without the thesis being invalidated.
3. Order flow: who takes the initiative right now
Order flow covers the tools that read executed orders: footprint, delta (the difference between aggressive buys and aggressive sells), absorption, imbalances. It is the finest and most demanding reading.
Two signals are worth learning first. The first is absorption: a price testing a level with a very positive delta that does not rise indicates that a large participant is absorbing the buying. The second is delta/price divergence: a new price high with a lower delta than at the previous peak, a sign that the buying initiative is running out of steam.
Be careful, however: order flow in the strict sense requires access to order book and time and sales data, often paid, and is not available on all platforms used by prop firms. Many candidates confuse the delta calculated on FX or CFD with the real futures order flow. The difference is significant and can lead to opposite conclusions.
Comparison table: which tool for which decision
| Tool | Question it answers | Time to master | Typical use in a challenge |
|---|---|---|---|
| VWAP | Who controls the session? | 1 to 2 weeks | Filter the direction of the day's trades |
| Volume profile | Where did the market agree to trade? | 4 to 8 weeks | Place targets and stops outside dense zones |
| Order flow (delta) | Who is taking the initiative now? | 3 to 6 months | Entry timing on a prepared level |
The logical progression is to master VWAP before adding volume profile, and to open order flow only once the first two have become automatic. A trader who jumps straight into order flow without understanding market structure ends up with very rich information and no decision framework.
Three concrete setups to test before your challenge
Setup 1: VWAP rejection in a trending session
Context: a clearly sloped VWAP, price moving more than 0.5% away from it and then coming back to test it. Entry condition: a reaction (rejection wick, delta flipping) in the VWAP zone. Stop: below the low of the reaction, generally 0.15 to 0.25% of the index. Target: the previous session high. Typical risk/reward: 1 to 2 up to 1 to 2.5. Frequency: one to two occurrences per day on the NAS100, no more.
Setup 2: value area breakout with confirmed volume
Context: price leaving the value area after a consolidation phase of several hours. Condition: the volume of the breakout candle must exceed by at least 50% the average of the last twenty candles of the same timeframe. Without this filter, the breakout is a statistical trap. Stop: on the other side of the value area. Target: the next HVN above or below.
Setup 3: return to the POC after an excess
Context: price moves sharply away from the POC on an economic release, then stops progressing. Target: a return to the POC. This setup has the best probability but the highest drawdown risk, because it requires holding against the initial move. Reserve it for traders who have already validated a challenge, not for beginners.
How to integrate volume into a compliant trading plan
A prop firm trading plan must stay readable on one page. Add just three lines:
- Context filter: price position relative to VWAP and VWAP slope at the open of the traded session.
- Decision level: POC, value area edges, major HVNs from the previous week.
- Risk per trade: 0.25 to 0.5% of initial capital, never more, which leaves room even after five consecutive losses on an account with a 5% daily drawdown.
This structure has a little-known advantage: it makes the trading journal verifiable. If a breached account is contested, a history where every entry is backed by a documented volume level is a factual argument. Conversely, an account closed for "inconsistent trading" without traceable justification is hard to defend. This is worth knowing before signing: our guide on protecting the funded trader when a prop firm suspends payouts details the possible remedies.
The five most expensive mistakes
- Confusing broker volume with market volume. The volume displayed on a CFD depends on the liquidity provider. On indices, work with futures data (NQ, ES, YM) to read true volume.
- Using VWAP as a standalone entry signal. VWAP is a context filter, not a trigger.
- Trading LVN breakouts without confirmation. A low volume zone is crossed quickly, in both directions.
- Stacking tools until paralysis. Three readings are enough. Beyond that, you analyse instead of executing.
- Forgetting the calendar. No volume tool protects you from an unexpected FOMC. Always cross-check your reading with the impact of economic releases on a challenge.
How long it takes to make this reading profitable
Based on the journeys we support, a disciplined trader reaches a reliable VWAP reading in two weeks of daily work (30 minutes of session analysis), the volume profile in two months, and profitable use of delta in six months. That is longer than the average challenge duration, which is precisely why the two calendars must be separated: you learn volume on a demo account, you validate the challenge with what you already master.
Our demo account preparation method and our backtesting protocol provide a framework to measure this progress objectively before paying registration fees. The Pack Basic covers the foundations (structure, VWAP, risk management); the Pack Gold adds volume profile and challenge-specific preparation; the Pack Elite includes individual coaching on advanced setups and trade reviews.
Key takeaways
Volume does not predict the future. It reduces uncertainty about the context, which is already enormous when a daily loss limit is waiting for you. Start with VWAP, add volume profile to place your targets, and only touch order flow after proving your consistency on demo. A trader taking three argued positions a day with 0.5% risk is statistically more likely to validate a challenge than a trader taking thirty without context, even if the latter is right more often.
To go further, see our complete NAS100 programme, our trading sessions guide and all Fundedtrader courses. Ready to put these principles into practice? Discover our challenge trading support.