Live Regarder
RegarderS&P 5007 373,9+6,60 (+0,09%)
US 10029 290,0−166,10 (−0,56%)
EUR/USD1,14049+0,003 (+0,30%)
Bitcoin60 079+382,00 (+0,64%)
Ethereum1 577,7+12,50 (+0,80%)
Or / Gold2 334,5+8,20 (+0,35%)
CAC 407 843,2−12,40 (−0,16%)
S&P 5007 373,9+6,60 (+0,09%)
US 10029 290,0−166,10 (−0,56%)
EUR/USD1,14049+0,003 (+0,30%)
Bitcoin60 079+382,00 (+0,64%)
Ethereum1 577,7+12,50 (+0,80%)
Or / Gold2 334,5+8,20 (+0,35%)
CAC 407 843,2−12,40 (−0,16%)
Prop Firms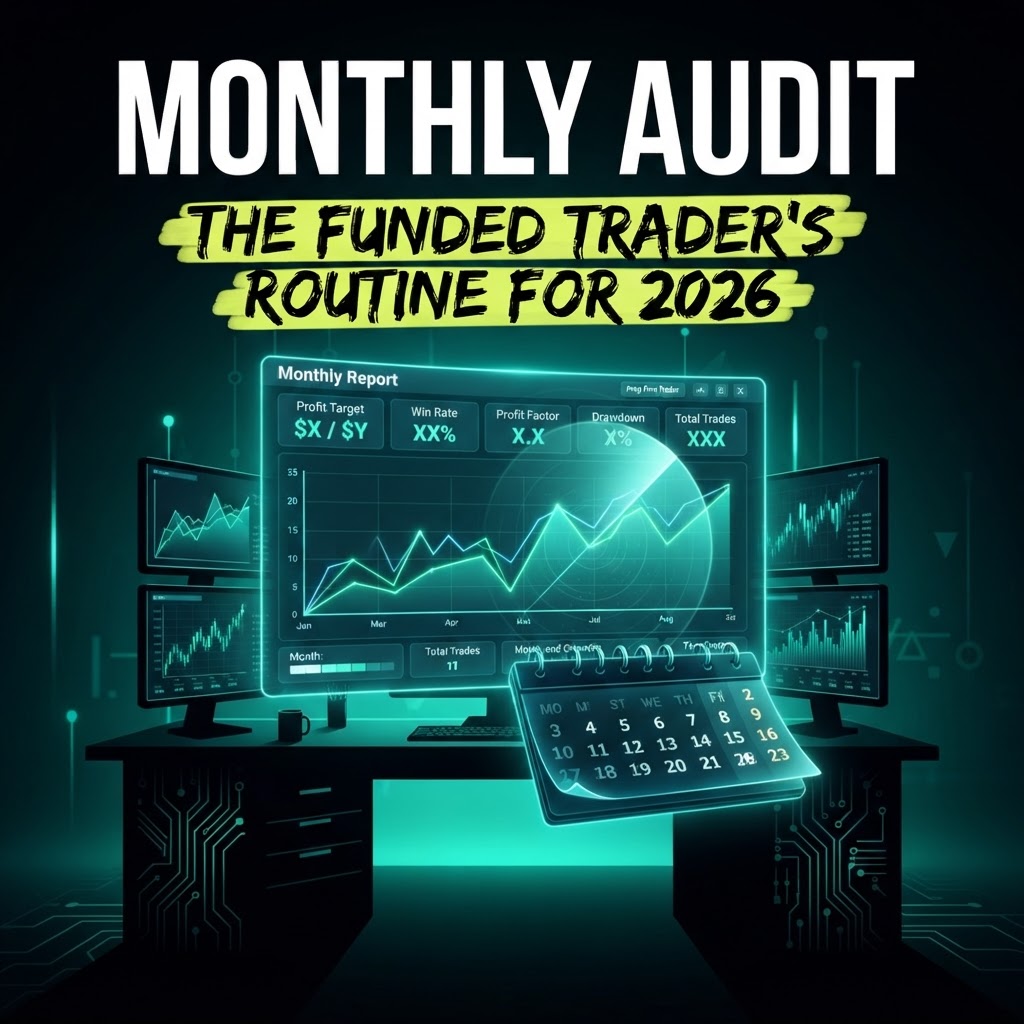 Prop Firms
Monthly Performance Audit for Prop Firm Traders in 2026
7 octobre 2026 7 min de lecture
Prop FirmsMonthly Performance Audit for Prop Firm Traders in 2026
## Why a monthly audit is essential in prop firm trading
Prop firm trading is not a sprint, it's a marathon. Between drawdown rules, profit targets and risk management, it's easy to lose your way in the heat of daily action. A monthly performance audit forces you to step back, analyze your results objectively, and adjust your trading plan before small problems become big ones.
In 2026, prop firms have tightened their rules: trailing drawdown at E8 Markets, 40% consistency rule at WeGetFunded, strict conditions at The5ers. A trader who doesn't review their strategy regularly will eventually lose their account. The monthly audit is your safety net.
## The metrics you absolutely need to track
### 1. Win rate
The percentage of winning trades. In prop firm trading, a win rate of 45 to 55% is sufficient if your risk-reward ratio is above 1.5. A win rate below 40% signals a setup selection problem. Don't try to improve it by forcing trades: identify your most profitable setups and eliminate the rest.
### 2. Profit factor
Profit factor = total gains / total losses. A profit factor above 1.5 means that for every dollar lost, you earn $1.50. A profit factor below 1.2 indicates your strategy isn't holding up: gains don't cover losses even with a good win rate.
### 3. Average R-multiple
The R-multiple measures the size of each gain or loss in multiples of your risk. If you risk $100 per trade (1R), a $200 gain is worth +2R and a $100 loss is worth -1R. Your average R-multiple must be positive. A trader with a 40% win rate and an average R-multiple of +1.5R is profitable; a trader with a 60% win rate and an R-multiple of -0.3R loses money.
### 4. Drawdown suffered vs maximum drawdown
Compare the actual drawdown experienced during the month to the maximum drawdown allowed by your prop firm. If your firm allows 5% drawdown and you hit 4.2% during the month, you were 0.8% away from losing your account. This number is the most critical of all.
### 5. Number of trades per day
A prop firm trader should take between 1 and 5 trades per day. Fewer than 1 trade per day on average: you're missing opportunities or over-analyzing. More than 5: you're overtrading and increasing your costs (spread, commission, slippage).
### 6. Performance by trading session
Analyze your performance by session: Asia (00:00-08:00 CET), London (08:00-17:00 CET), New York (13:00-22:00 CET). The majority of prop firm traders perform better on London and New York. If your results in the Asian session are negative for 2 consecutive months, stop trading that session.
## The step-by-step audit method
### Step 1: Export your data
Export your trade history from your platform (MetaTrader 5: Account tab, History, Right-click > All history > Save as report). If you use multiple accounts, export each one separately. Import the data into a spreadsheet (Google Sheets, Excel).
### Step 2: Calculate key metrics
In your spreadsheet, calculate for the past month:
- Total number of trades
- Win rate (%) = (winning trades / total) x 100
- Average gain ($) and average loss ($)
- Profit factor = sum of gains / sum of losses
- Average R-multiple = sum of R / number of trades
- Maximum drawdown of the month ($)
- Maximum daily loss ($)
- Performance by session (%)
- Performance by instrument (%)
### Step 3: Compare with the previous month
Note the evolution of each metric. A win rate dropping from 52% to 41% is not a problem if it's compensated by a better risk-reward ratio. But a profit factor dropping from 1.8 to 0.9 is a red alert: your edge is disappearing.
### Step 4: Identify the 3 biggest mistakes
Go through your losing trades and identify recurring patterns:
- Impulsive entries outside your setup?
- Premature exits on winning trades?
- No stop-loss on certain trades?
- Revenge trading after a loss?
- Overtrading on economic news days?
List the 3 most costly mistakes and estimate their impact in dollars.
### Step 5: Define 2 corrective actions
Select the 2 most impactful mistakes and define a concrete corrective action for each. Examples:
- Mistake: premature exits (3 trades would have earned +$400 more) -> Action: move stop-loss to breakeven after +1R and let the trade run to take-profit.
- Mistake: overtrading on NFP news days -> Action: do not trade 30 minutes before and after major announcements.
## The typical dashboard
Here's what your monthly audit table should look like:
| Metric | Month M | Month M-1 | Change |
|---|---|---|---|
| Total trades | 62 | 58 | +4 |
| Win rate | 48% | 52% | -4 pts |
| Profit factor | 1.7 | 1.4 | +0.3 |
| Avg R-multiple | +0.4R | +0.2R | +0.2R |
| Max drawdown | $1,800 | $2,200 | -$400 |
| Max daily loss | $450 | $600 | -$150 |
| Net gain | +$3,200 | +$1,800 | +$1,400 |
This table takes 10 minutes to fill in and gives you a clear view of your trajectory.
## Warning signs to watch for
### Profit factor declining over 2 months
If your profit factor drops below 1.2 for 2 consecutive months, your edge is eroding. Possible causes: market conditions have changed, your strategy no longer works in the current regime, or you're deviating from your plan. Cut your risk in half while diagnosing.
### Drawdown approaching the limit
If you've hit 70% or more of the maximum allowed drawdown during the month, you're in the danger zone. The following month, cut your risk per trade in half and tighten your setup selection.
### Concentration on a single instrument
If more than 60% of your trades are on a single pair (e.g. EUR/USD), you're too concentrated. Diversify to 2-3 instruments to reduce correlation risk.
### Increasing emotionality
If you note in your journal that you're increasingly frustrated, thinking about trading outside sessions, checking your positions every 5 minutes: you're in latent tilt. Take 2 days off.
## The quarterly in-depth audit
Every 3 months, go beyond the monthly audit:
- **Backtest your strategy** over the past 3 months to verify that your theoretical edge matches your actual performance
- **Review all your prop firm rules** to detect condition changes
- **Tax analysis**: are your cumulative quarterly revenues approaching a tax threshold (VAT, tax bracket)?
- **Multi-account review**: if you have multiple funded accounts, compare the performance of each account and arbitrate the least profitable ones
## Automating the audit
### The digital trading journal
A structured trading journal (Notion, or a simple Google Sheets) with these columns: date, instrument, direction (long/short), setup, entry, stop, exit, result ($), R-multiple, session, psychological notes. Filled in after each trade, it becomes your database for the monthly audit.
### Analysis tools
MetaTrader 5 generates a complete history report. MyFxBook and FXBlue allow you to track your performance automatically. For futures accounts (Apex, Topstep), use the platform's built-in report (Tradovate, NinjaTrader).
## Conclusion
The monthly performance audit is not an administrative chore, it's the most powerful tool available to a prop firm trader to improve. Ten minutes of dashboard, thirty minutes of error analysis and two corrective actions per month are enough to transform an average performance into a consistent and profitable one. The traders who survive in prop firms in 2026 are not the most talented: they are the most disciplined in their performance tracking.
## Articles related to prop firm performance audit
- [Trading journal: why it's essential to validate a challenge](/blog/journal-de-trading-pourquoi-il-est-essentiel-pour-valider-un-challenge)
- [Risk management: how much to risk per trade in a challenge](/blog/gestion-du-risque-combien-risquer-par-trade-en-challenge)
- [Account management mistakes after funding](/blog/erreurs-de-gestion-de-compte-apres-financement)
- [How to handle a losing streak in a trading challenge](/blog/comment-gerer-une-serie-de-pertes-en-challenge-de-trading)
Pour aller plus loin
Prêt à valider votre challenge prop firm ?
FundedTrader accompagne vos challenges jusqu'au compte financé, quelle que soit la prop firm choisie.
Voir nos services de validation Appel gratuit
Notre équipe est à votre écoute
Réservez un échange gratuit avec nos traders pour parler de votre projet prop firm.
Trustpilot
Excellent
4,4/5